Monitoring Kubernetes integration guide
Monitoring in Kubernetes is integrated with the FPT Monitoring system to collect metrics and logs and to provide dashboards and alerts as needed.
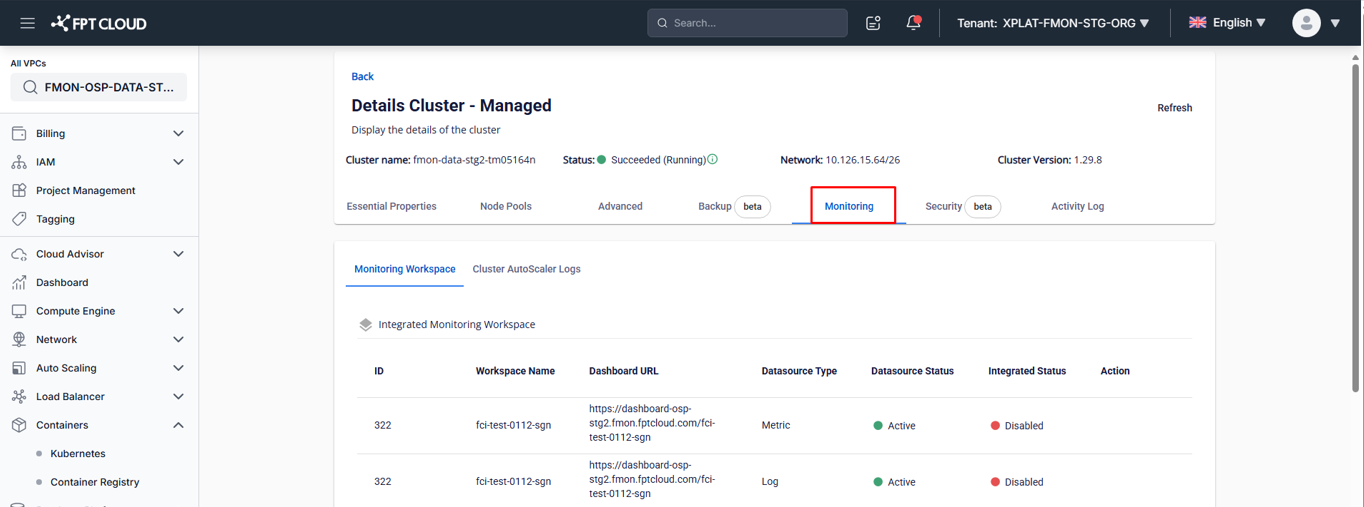
Step 1. Access the Monitoring feature
- In Console Portal, open a Kubernetes cluster detail page.
- Select the Monitoring tab.
The Monitoring integration screen displays the list of metrics/logs by type. Items not yet integrated with FPT Monitoring show Status = "Disabled".
Step 2. Integrate or disintegrate
Integrate
Enable metrics/logs collection for the cluster.
- On the Monitoring screen, select the Integrate action for the desired workspace.
- Confirm the action in the warning dialog to complete.
- After successful integration, Integrated Status changes to "Enabled" and FPT Monitoring starts collecting the corresponding metrics.
Disintegrate
Disable metrics/logs collection for the cluster.
- On the Monitoring screen, select the Disintegrate action for the workspace you want to stop monitoring.
- Confirm the action in the warning dialog to complete.
- After successful disintegration, Integrated Status changes to "Disabled" and the system stops collecting the corresponding metrics.
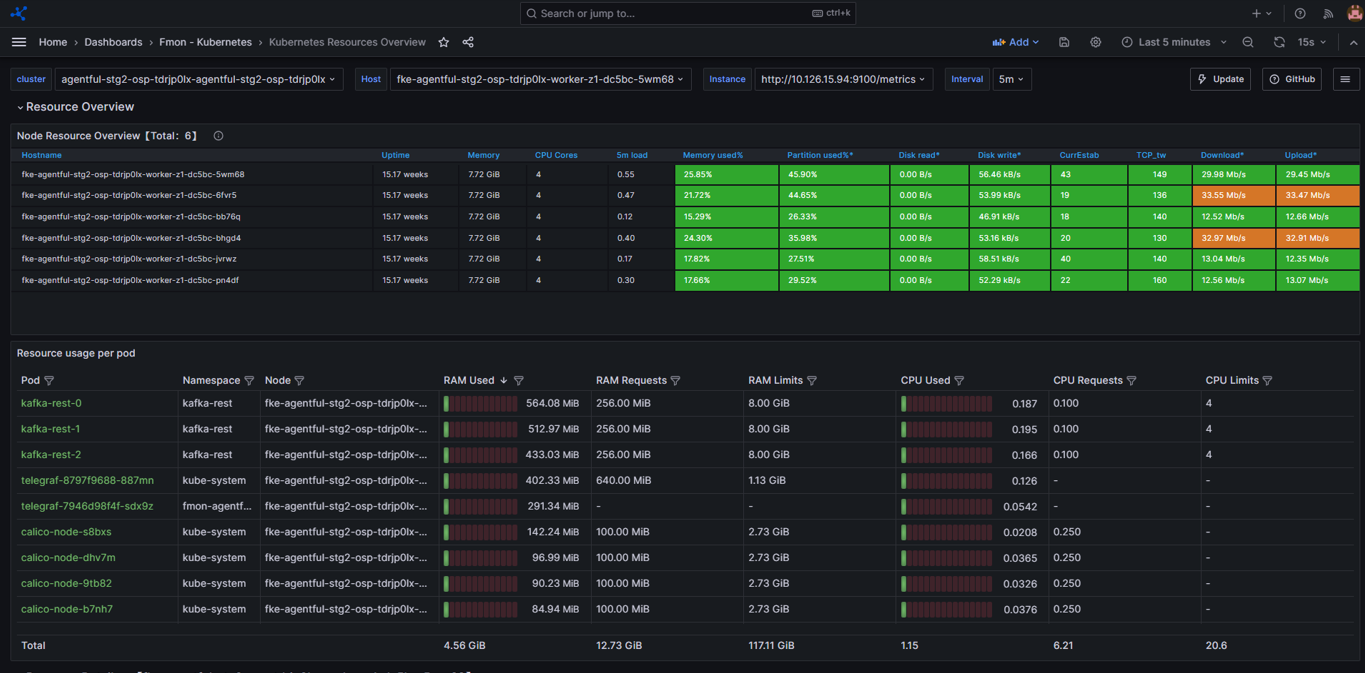
Step 3. Open the Grafana dashboard and view monitoring data
- After successful integration (Integrated Status = "Enabled"), click the Dashboard URL.
- Integrate the relevant dashboard templates — see Dashboard template integration.
- Open an integrated dashboard to view monitoring data.