Dashboard
Overview
- The Dashboard provides an overview of the operating status of Firewalls in the system.
- Users can quickly monitor network traffic, traffic-handling status (Allow/Deny), system performance, and the most-used rules.
Procedure
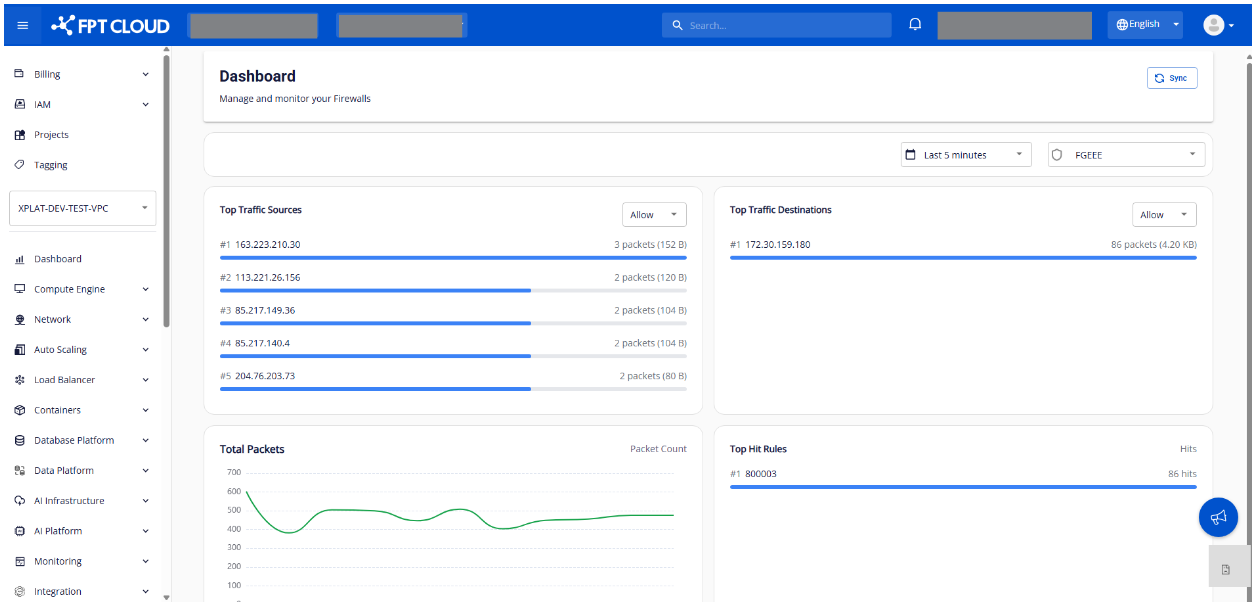
Step 1. Select the Dashboard tab in the menu. The system displays the Dashboard screen.
Step 2. Select a Firewall and Time Range.
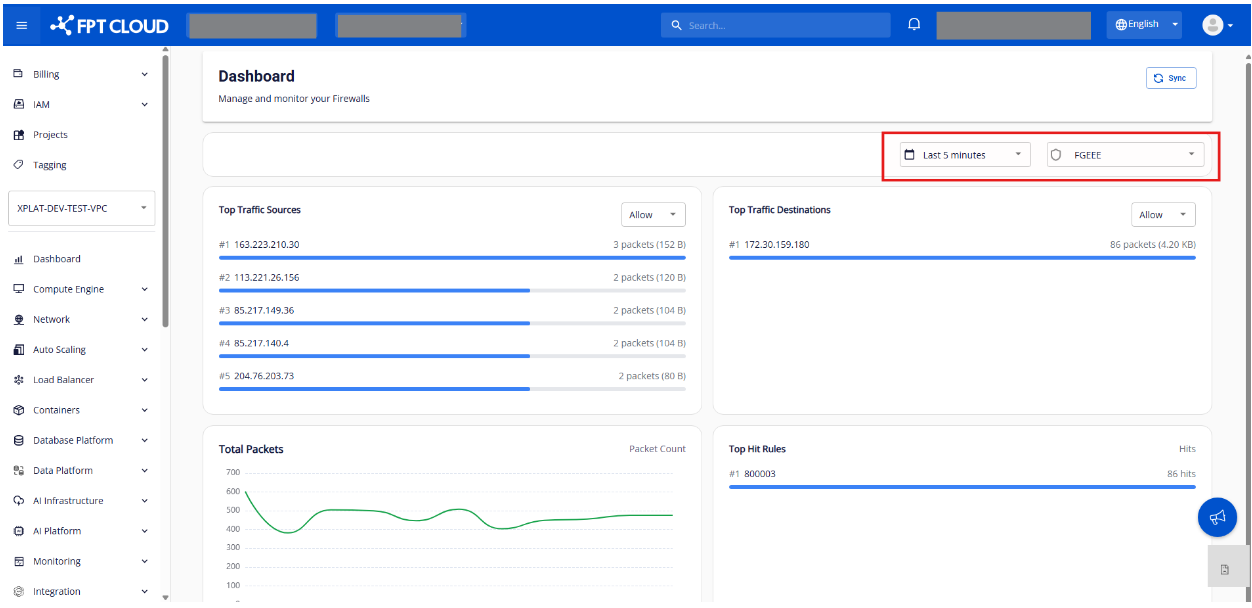
- Pick a Firewall from the dropdown → the Dashboard displays data for the selected firewall.
- Pick a Time Range (default:
Last 5 minutes) → the system reloads all data for the new time window.
Step 3. Monitor and analyze the information.
Traffic source analysis — Top Traffic Sources
Top 5 Source IPs generating the most traffic:
- Filter by:
Allow/Deny - Identify IPs that generate abnormal traffic
- Helps detect attack vectors (DDoS, scans)
Destination analysis — Top Traffic Destinations
Top 5 most-accessed Destination IPs:
- Filter by:
Allow/Deny - Identify the destinations accessed most often
- Detect unusual or suspicious outbound connections
Traffic trend monitoring — Total Packets
Chart of total packets over time:
- Allow (green)
- Deny (red)
Active-rule tracking — Top Hit Rules
Top 5 most-triggered firewall rules:
- Identify the most-important rules
- Detect abnormal rules that need optimization
Network throughput
Throughput chart for 3 directions:
InboundOutboundInternal
Active connection assessment
Displays the number of connections over time to evaluate system load.
Performance monitoring — CPU & Memory
Tracks CPU and Memory usage to assess performance.